
0.0 Executive Summary
This report documents the implementation and analysis of system resource monitoring in an Ubuntu Server environment. The objective was to monitor the CPU, memory, and swap usage using the Linux command-line tools. The project focused on using native utilities to collect real-time performance information and validate the availability of system resources.
Several monitoring tools were tested using different output and filtering options to improve troubleshooting visibility and establish a baseline for the normal system performance. The result was a validated monitoring workflow that supports system administration, troubleshooting, capacity planning, and security.
1.0 Monitoring System Resources
1.1 Project Description
The goal of this task was to develop practical skills for monitoring Linux system performance and identifying resource-related issues before they affect system stability.
The implementation used multiple Linux monitoring tools to:
- Monitor CPU and memory usage in real time
- Identify processes consuming excessive resources
- Validate total available memory and swap space
- Generate readable outputs for troubleshooting and reporting
The project also demonstrated how monitoring tools can assist administrators in performance incidents and security investigations.
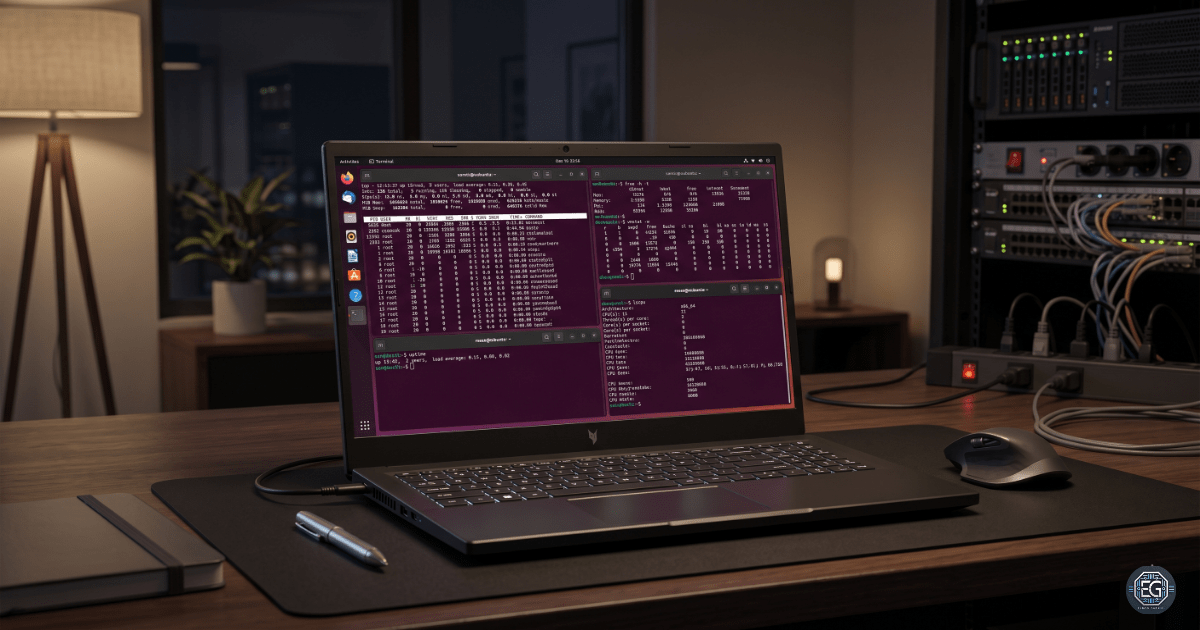
1.2 Technical Task / Troubleshooting Process
The process focused on collecting and validating the system performance data using native Linux utilities.
Key Actions and Observations
- Memory Utilization Monitoring
- Used
free -h -tto display human-readable memory statistics, including RAM and swap totals. - Used
cat /proc/meminfoto review the raw kernel memory information for manual validation.
- Used
- CPU and Process Monitoring
- Used
topto identify processes that consume high CPU and memory resources. - Used
top -uto filter processes by specific users to isolate the impact.
- Used
- Virtual Memory Monitoring
- Used
vmstat -wto review the virtual memory statistics using a wide-format output. - Verified that the wide mode prevented column formatting issues on larger terminal displays.
- Used
Troubleshooting Highlights
- Manual Calculation Complexity
- Raw values from
/proc/meminfowere difficult to interpret quickly because memory values were displayed in kilobytes. - This issue was resolved using
free -h -t, which automatically converts values into human-readable units.
- Raw values from
- Display Formatting Issues
- The standard
vmstatoutput produces compressed columns on wider systems. - This issue was corrected using the
-wflag to improve the readability.
- The standard
1.3 Resolution and Validation
The monitoring configuration was validated by checking the command accuracy and confirming successful output generation.
| Parameter | Configuration Value |
|---|---|
| Primary Monitoring Tools | top / free |
| Output Format | Human-Readable (-h) |
| Monitoring Scope | Real-Time System Performance |
Validation Steps
- Memory Validation
- Verified that
free -h -tcorrectly displays RAM and swap totals. - Compared results against values from
/proc/meminfoto ensure output accuracy.
- Verified that
- Tool Functionality Validation
- Confirmed that all requested flags (
-h,-t,-u,-w) were functional and produced the expected filtered or formatted outputs.
- Confirmed that all requested flags (
2.0 CONCLUSION
2.1 Key Takeaways
- Human-readable flags, such as
-himprove the speed and accuracy of system analysis. - Validation is not just about seeing if a command works; it is about ensuring that the output is accurate.
- Using
free -h -tcombines formatting and calculation, making it a “stress test” for the basic functionality of the utility. - The
vmstat -wcommand prevents column misalignment on high-resolution display. - Native Linux monitoring utilities provide sufficient visibility for most baseline-troubleshooting tasks.
2.2 Security Implications and Recommendations
Risk: Resource Exhaustion (Denial of Service)
Unmonitored processes can consume excessive CPU or memory resources, causing system instability and service interruption.
Mitigation
- Monitored swap usage and sustained high CPU utilization.
- Establish baseline performance thresholds.
Risk: Compromised User Activity
Compromised accounts may execute unauthorized background processes, such as cryptominers or resource abuse scripts.
Mitigation
- Use
top -uduring routine audits to isolate the resource impact of a specific user account. - Monitor unexpected spikes in the per-user resource consumption.
Best Practices
- Consistent measurement units should be used during reporting and analysis to avoid calculation errors in capacity planning.
- Establish baseline system performance values for accurate detection of deviations.
- Ensure that the swap space is active and factored into the total available memory before launching high-load applications.
- Regularly used validation commands such as
free -h -tto prevent human error during manual calculations.
Framework Alignment
- NIST CSF (DE.CM): Continuous monitoring supports detection of abnormal system behavior.
- CIS Control 12: Monitoring infrastructure performance improves system availability and operational awareness.
- ISO 27001 A.12.1.3: Capacity management requires monitoring and adjustment of system resources.